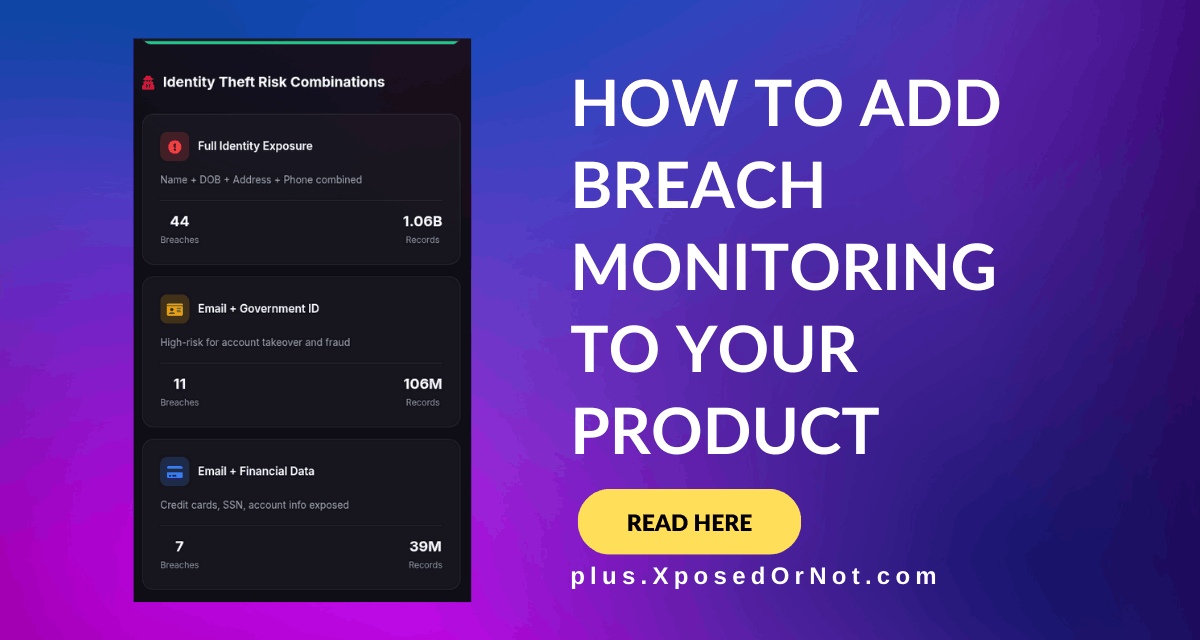
How to Add Breach Monitoring to Your Product
Monitor client domains for breach exposure. No infrastructure to build.
Up and running in under 15 minutes.
TL;DR
Your customers need breach monitoring. Building it yourself means years of data acquisition and constant maintenance. xonThreatIntel+ gives you a multi-domain dashboard, white-label reports, and API access to 11.5 billion+ credentials from our breach repository . Monitor hundreds of client domains from one place.
The Build vs Buy Reality
Let's talk about what building breach monitoring actually looks like.
You need data. Not scraped junk. Fresh breach data from dark web forums, paste sites, underground markets. That means researchers, infrastructure, and ongoing acquisition costs. Six figures annually. Minimum.
Then you need to process it. Parse different formats. Deduplicate records. Build search indexes that work at scale. Another engineering team. Another six months.
And you need to keep it current. Breaches happen daily. Your data goes stale fast.
Or you can plug into a platform that already solved all of this.
That's what ThreatIntel+ offers. Ten years of breach aggregation. Billions of records. Maintained infrastructure. You focus on your product. We handle the data.
Who This Is For
Security product companies. You're building a security platform and want breach monitoring as a feature. Add it via API without building the backend.
MSSPs and MSPs. You manage security for multiple clients. Monitor all their domains from one dashboard. Alert when their employees or customers show up in breaches.
Consultancies and VARs. You advise clients on security. Show them their exposure with branded reports. Deliver ongoing monitoring as a service.
Same platform. Different integration paths.
How Domain Monitoring Works
Three steps. That's it.
Step 1: Add Your Domains
Log into the ThreatIntel+ dashboard. Click "Add Domain." Enter the domain you want to monitor. Takes about 10 seconds. Monitor one domain or hundreds. The dashboard handles both.
Step 2: Continuous Monitoring Begins
Our systems scan continuously. Every email address at your domain gets checked against 11.5 billion+ breach records. New breaches are added within 24-72 hours of disclosure.
We monitor what attackers monitor: dark web marketplaces, underground forums, paste sites, breach disclosure channels.
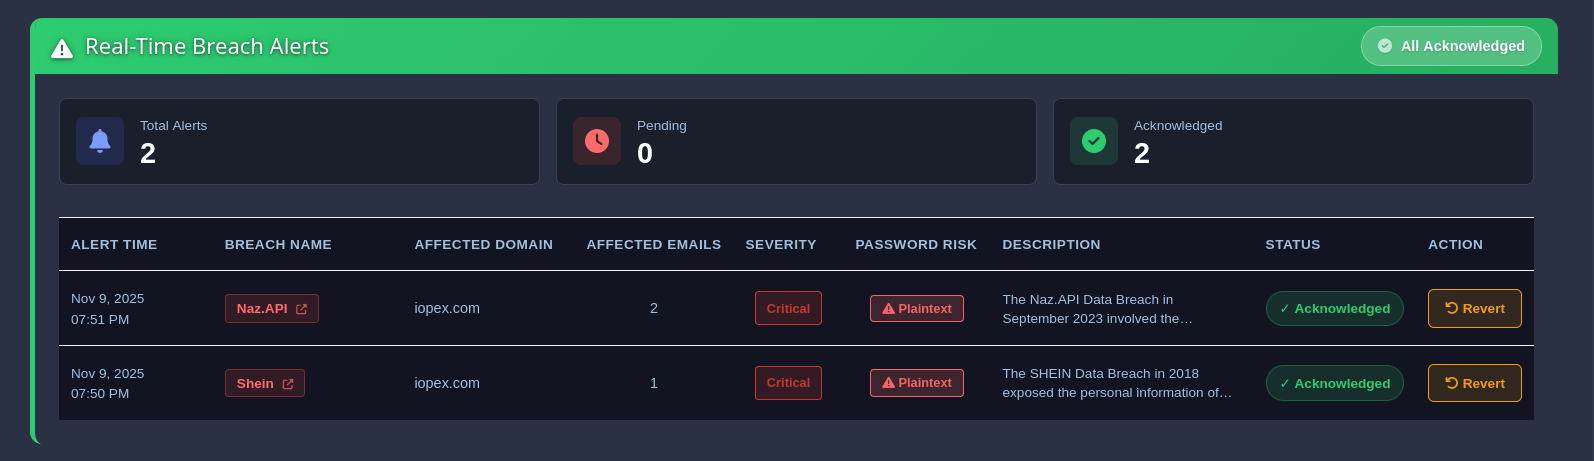
Step 3: Get Alerted When Exposures Are Found
Choose how you want to know:
- Email alerts to your security team
- Slack or Teams notifications to your channels
- SIEM integration with Azure Sentinel and Sumo Logic for centralized logging
- Webhooks to trigger your own workflows
Alerts include which accounts are exposed, what data leaked, and risk severity.
White Glove Onboarding
Not sure where to start? We'll help. Every ThreatIntel+ account includes white glove onboarding as part of the setup process:
- Dedicated setup call with our team
- Domain configuration assistance for complex setups
- Alert routing help to connect your preferred channels
- Report customization to match your branding
- API integration guidance for developers
White glove onboarding is delivered for all customers as part of onboarding to ensure they get the benefits at the earliest.
The Dashboard Experience
Built for teams managing multiple domains.
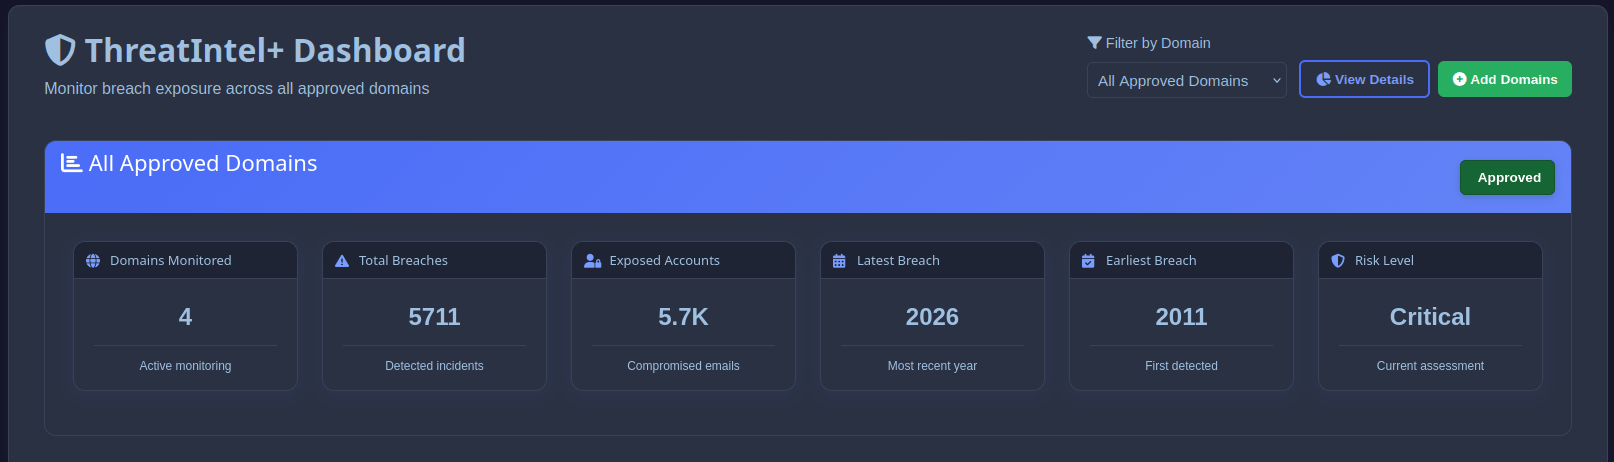
All Domains in One View
See breach exposure across every domain you monitor. Filter by risk level, breach date, or data type. Drill into specific domains when you need detail. No logging into separate accounts. One dashboard for everything.
Real-Time Breach Counts
Each domain shows:
- Total exposed accounts
- New exposures this month
- High-risk accounts (plaintext passwords)
- Breach sources
Spot problems before your clients do.
Guided Remediation
When we find exposed accounts, you get clear next steps: which accounts need password resets, which should enable MFA, which appeared in high-risk breaches, and a timeline of exposure. Turn alerts into action. Not just data dumps.
White-Label Reports for Clients
Your clients want proof of value. We generate reports you can brand as your own.
What's included: Executive summary (non-technical, C-level friendly), detailed breach breakdown by date and source, account-level exposure data, risk scoring and prioritization, remediation recommendations, and trend analysis over time.
Your branding, your delivery. Add your logo. Customize colors. Remove our name entirely if you prefer. PDF export for board presentations. Web links for ongoing access.
Show clients exactly what you're protecting them from.
API Access for Product Integration
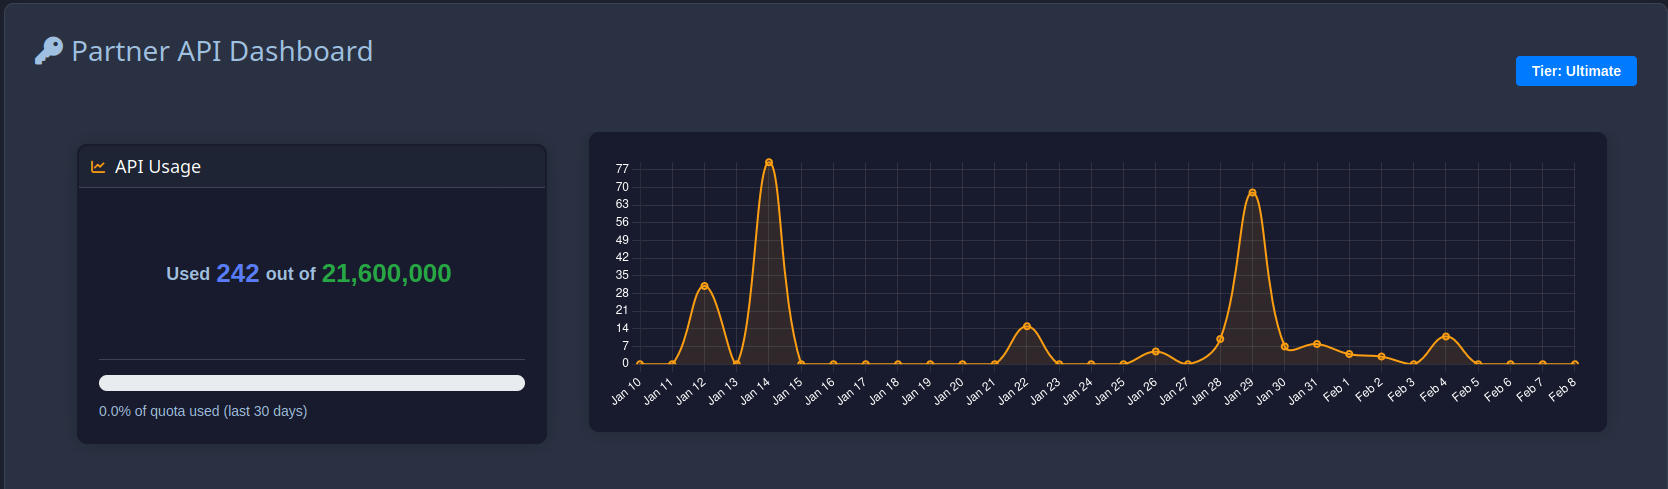
Building breach monitoring into your own product? Use the Partner API .
Domain Breach Summary
Query breach exposure for any domain you monitor. Get total exposed emails, breach counts, and a breakdown by employee seniority.
import requests

# Query domain breach summary via Partner API
url = "https://plus-api.xposedornot.com/v2/partner/domain-summary"
headers = {"x-api-key": "YOUR_API_KEY"}
params = {"domain": "example.com", "details": "true"}

response = requests.get(url, headers=headers, params=params)
data = response.json()

print(f"Domain: {data['domain']}")
print(f"Total exposed emails: {data['total_exposed_emails']}")
print(f"Total breaches: {data['total_breaches']}")

for role, count in data["exposures_by_seniority"].items():
    print(f"  {role}: {count} exposed")
Sample Response
{
  "status": "success",
  "domain": "example.com",
  "total_exposed_emails": 1250,
  "total_breaches": 15,
  "exposures_by_seniority": {
    "CXO": 5,
    "VP": 12,
    "Director": 45,
    "Manager": 188,
    "Employee": 1000
  },
  "recent_breaches": [
    {
      "breach_id": "RecentBreach",
      "breached_date": "2024-01-01T00:00:00+00:00",
      "exposed_count": 150
    }
  ]
}
What the API returns: total exposed emails across the domain, breach count, exposures broken down by employee seniority (CXO, VP, Director, Manager, Employee), recent breach details with dates and exposed counts, and processing status.
Authentication is via x-api-key header. Full API documentation covers domain management, email breach checks, bulk uploads, error handling, and rate limits.
SDKs Available
The Python SDK includes comprehensive documentation and automatic retry logic. The Node.js SDK adds TypeScript support out of the box.
Webhooks for real-time alerts. Get notified when domains you monitor appear in new breaches. No polling required. Configure webhook endpoints in the dashboard. We push alerts as they happen.
Coverage and Data Quality
Last updated: July 2026
Not a number we made up. That's actual breach records from verified incidents spanning a decade of collection. Explore the full list in our breach repository .
Sources we monitor: dark web marketplaces, underground forums, paste sites (Pastebin and alternatives), breach disclosure channels, and security researcher networks. When a breach surfaces, we typically have it indexed within 24-72 hours.
Data Categories Tracked
Not all breaches expose the same data. We categorize what's exposed:
High Risk: Plaintext passwords, weakly hashed passwords (MD5, SHA1), financial data, government IDs.
Medium Risk: Strongly hashed passwords, phone numbers, physical addresses.
Context Data: Email addresses, usernames, IP addresses.
This feeds the risk scoring. A breach with plaintext passwords ranks higher than one with bcrypt hashes. Every account gets a risk score based on number of breaches, recency, password exposure type, and data categories exposed. High-risk accounts get forced resets, medium-risk get advisories.
Pricing for Partners
Managing 50+ domains? Volume pricing kicks in. See full details on our ThreatIntel+ pricing page.
| Domains | Discount |
|---|---|
| 50 – 99 | 15% off |
| 100 – 249 | 25% off |
| 250 – 499 | 35% off |
| 500+ | Custom |
More clients you onboard, better your margins. Annual billing saves 20%.
Every ThreatIntel+ plan includes: multi-domain dashboard access, white-label client reports, API access, Slack/Teams/email alerts, webhook support, white glove onboarding, and priority support.
For custom pricing, reach out to [email protected].
Compliance and Audit Support
Zero PII storage. We don't store your client data from queries. Checks happen in real-time against our breach database.
Audit trails. Every domain check and alert is logged: timestamp, domain checked, results summary, alert delivery status. Export logs for compliance audits.
Document breach monitoring as a proactive control:
| Framework | Relevant Controls |
|---|---|
| SOC 2 | CC6.1 (Logical Access), CC7.2 (Monitoring) |
| ISO 27001 | A.9.4.3 (Password Management), A.12.4.1 (Logging) |
| NIST CSF | PR.AC-1 (Identity Management), DE.CM-3 (Monitoring) |
| PCI DSS | 8.2.3 (Password Requirements), 10.2 (Audit Trails) |
Getting Started
- Create account at plus.xposedornot.com
- Schedule onboarding call (optional but recommended)
- Add your first domain from the ThreatIntel+ dashboard
- Configure alert channels (Slack, email, webhook)
- Review initial breach exposure report
- Add remaining client domains
- Customize report branding
- Set up API integration (if applicable)
See it working first. Check domain exposure free
Why Teams Choose ThreatIntel+
Coverage
11.5 billion+ credentials. Fresh data added daily.
Speed
Sub-100ms API response. Real-time dashboard.
Simplicity
15 minute setup. No infrastructure to manage.
Support
White glove onboarding. Priority response times.
Economics
Volume discounts that improve as you grow.
Start with ThreatIntel+
30-day money-back guarantee. No long-term contracts.
Partners: contact [email protected] for volume pricing.