
Under 100ms Across 11.6B Records: How Our Breach Check Works
A breach check against 11.6 billion+ records doesn't search 11.6 billion records. It fetches one. The email address is the key, and the index could double tomorrow without that fetch getting any slower.
That's the whole trick. Everything after it is the proof.
We're XposedOrNot. We run the public breach index (792 breaches and 11.6 billion+ records as of 12 October 2026, counted live by our API) and the partner API on top of it, the one xonAPI+ and xonThreatIntel+ customers call. The API code is open source on GitHub , so every claim below points at a file you can read.
Why write this at all? Because before a platform team embeds us, or an MSSP resells us, the same three questions turn up on the call.
How fast is it, really. What's cached, and for how long. And what happens when something breaks.
So, three answers. With numbers measured on the paid host, not promised.
Four terms first, because two of them get mixed up constantly:
| Term | What we mean |
|---|---|
| Key lookup | Fetch one record by its exact name. The cost doesn't grow with the size of the store |
| Scan | Read through many records looking for matches. The cost grows with the store |
| Processing time | The clock inside our service, from request in to response out |
| Round trip | What your code sees: processing time plus the network between you and us |
One request, six stops
Here's a single check, followed from your server to the answer.
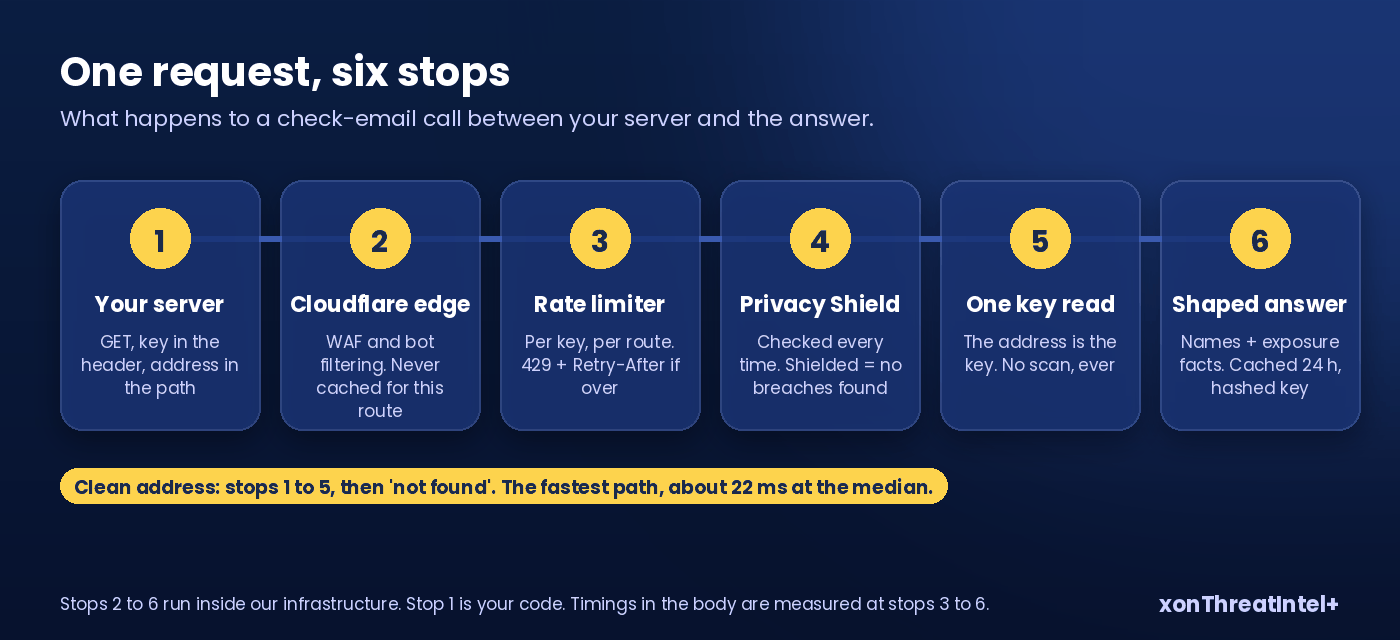
Your server sends it
A GET to the check-email route on the partner API, your key in the header, the address in the path. That's the entire query. No body, no filters, nothing to paginate.
xonAPI+ issues the key with the plan. xonThreatIntel+ ships one inside every package, so there's nothing extra to buy for the API side.
The edge looks first
The request lands on Cloudflare before it lands on us. The web application firewall and the bot filtering do their work there, on their hardware, before our code sees a byte.
A per-email check never stops there, though. We looked on 12 October 2026 and every response on that route came back marked dynamic. Not cached at the edge, not for a second.
You'll see why that matters two stops down.
The limiter counts you
Each key has a budget: 50 requests a minute on the entry xonAPI+ tier, 25,000 a minute at the top of the volume tiers. The counting happens in Redis, per key, per route.
Go over it and you get a 429, a Retry-After header, and a JSON body with the reset time. Your client backs off to the second instead of guessing. No silent drops, ever.
Privacy Shield is checked every time
Before any result is built, we look up whether the address owner has switched on Privacy Shield . If they have, the answer is "no breaches found". To everyone, paying customers included.
The flag is cached for 60 seconds and written through the moment someone changes it. And if Redis is having a bad moment? The lookup goes to the database instead.
The check is never skipped. (Which is the reason a per-email response can't be left sitting in an edge cache.)
One key, one read
Now the part the title rests on. The address, lowercased, is the name of one record in Google Cloud Datastore.
We ask for that record. We get it, or we get nothing.
No query runs. Nothing is scanned. Every one of those 11.6 billion records was folded into a per-address entry back when its breach was indexed, so the read is the same size at one breach or at 792.
At 1,500? Still the same read.
The answer is shaped and remembered
The record holds breach names. The details behind each name (date, exposed data classes, record count, how the passwords were stored) come from an in-process copy of the catalog.
It refreshes every 15 minutes, serves the old copy while the new one loads, and reads straight from the database for any breach it hasn't met yet. A breach we indexed a minute ago still shows.
Then the result is cached for 24 hours under a hashed key, and sent back. Breach names and exposure facts go in it. A password, in any form, never does.
Where the 100 ms is measured, and where it isn't
"Under 100 ms" is processing time. The clock inside the service, which Cloud Run records for every request. It doesn't include the network between your server and ours, and anyone who tells you their figure does is measuring from one place on Earth.
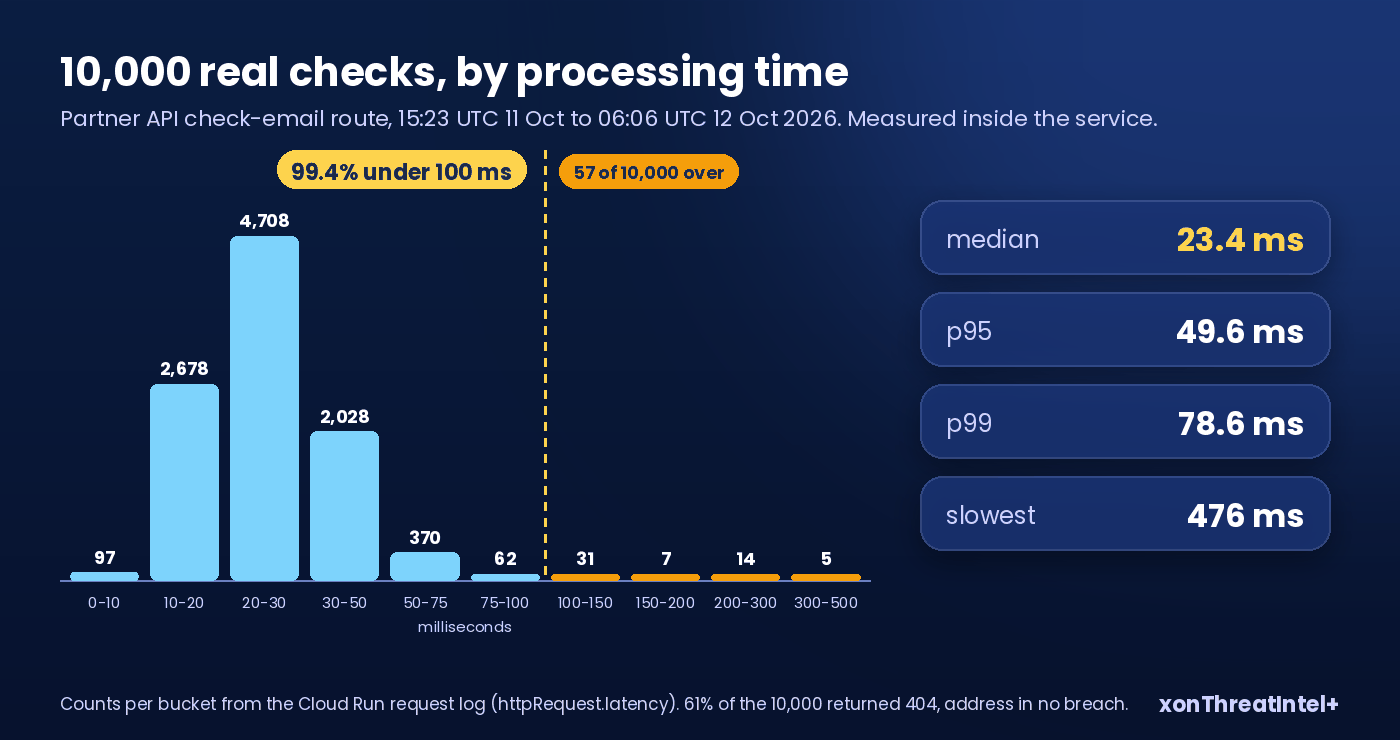
Here's the receipt. We pulled 10,000 consecutive check-email requests from the production log of the partner API, 15:23 UTC on 11 October to 06:06 UTC on 12 October 2026. Real customer traffic, about fifteen hours of it.
| Measure | Value |
|---|---|
| Requests | 10,000 |
| Median (p50) | 23.4 ms |
| p95 | 49.6 ms |
| p99 | 78.6 ms |
| Slowest | 476 ms |
| Under 100 ms | 99.4% |
| Under 50 ms | 95.1% |
Fifty-seven requests out of ten thousand crossed 100 ms. The five slowest sat between 300 and 476 ms, and the honest answer on those is that the log line doesn't say why.
A cold instance, or a slow read at the storage layer. We're not going to dress that up.
One detail we liked. Six in ten checks came back clean, address in no breach at all, and those were the quickest of the lot: a median of 21.9 ms against 25.4 ms for a hit. The clean path has no breach details to assemble, so it's the shortest road through the service.
Now your round trip. From Singapore on 12 October 2026, our test machine's TLS handshake to the edge alone took about 145 ms, before a single byte of the request moved. The service runs in Oregon (Google Cloud's us-west1), so a request from Asia or Europe spends more time in flight than inside our code.
What to do with that?
Keep connections alive so the handshake happens once, not per call. And measure from the region your product actually runs in.
In our experience that first change does more for a login flow than anything we could shave off the 23 ms.
Does 23 ms even register with a user? Akamai's 2017 retail performance study found a 100-millisecond delay in page load cut conversion by 7%. A breach check inside signup or login is part of that page load, so it has to be invisible. At the median, 23 ms is.
Three caches, three clocks
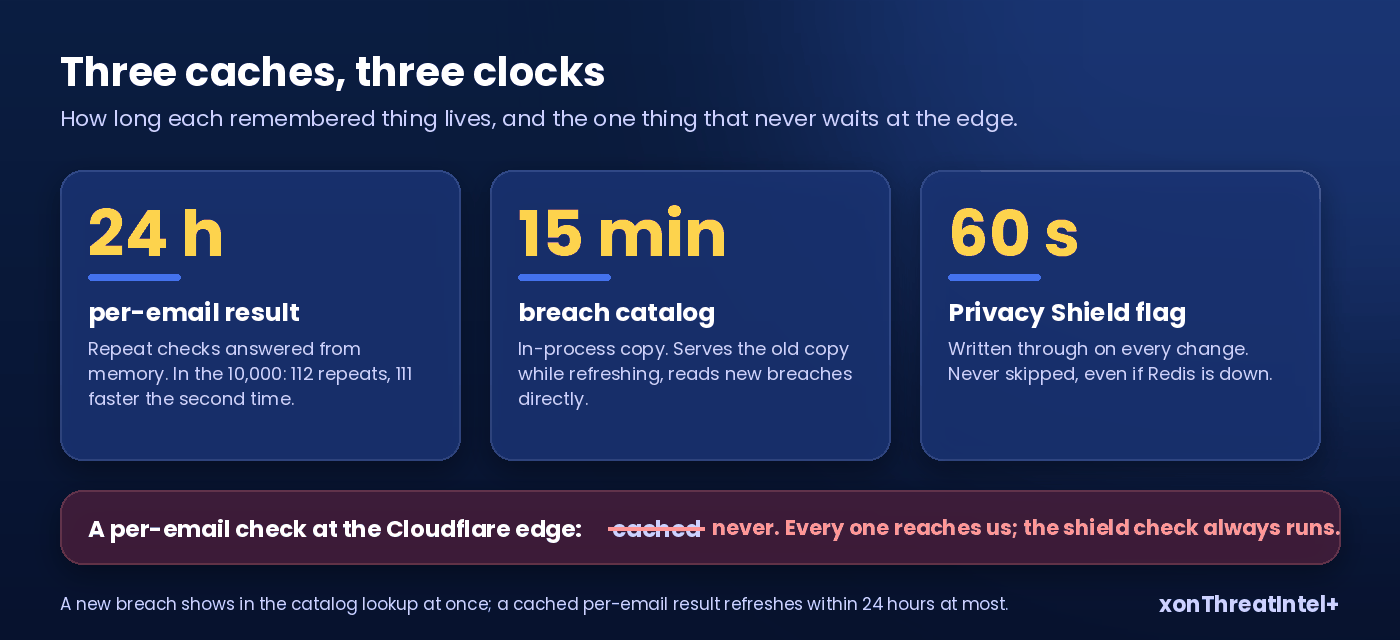
Every cache on the path, and how long each one lives.
| What | Lives for | Why it's there |
|---|---|---|
| Per-email result | 24 hours | Repeat checks of one address are answered from memory. In the 10,000, the same address came back within ten minutes 112 times, and 111 of those were faster the second time (23 ms then 8 ms is typical) |
| Breach catalog | 15 minutes, in-process | Breach details without a database trip per name |
| Privacy Shield flag | 60 seconds, write-through | Short on purpose. And never skipped, as above |
So what happens when we index a new breach? It's visible in the catalog lookup at once. A per-email result cached before the breach landed refreshes within 24 hours at most, and the next uncached check for that address sees it immediately.
For monitored domains the clock is different, and shorter. Alerts go out under 15 minutes for onboarded domains after a breach lands in our index. That's the number for a client proposal, not the cache lifetime.
When a part fails
Four moving parts sit on the path beside our own code, and each one has a planned failure.
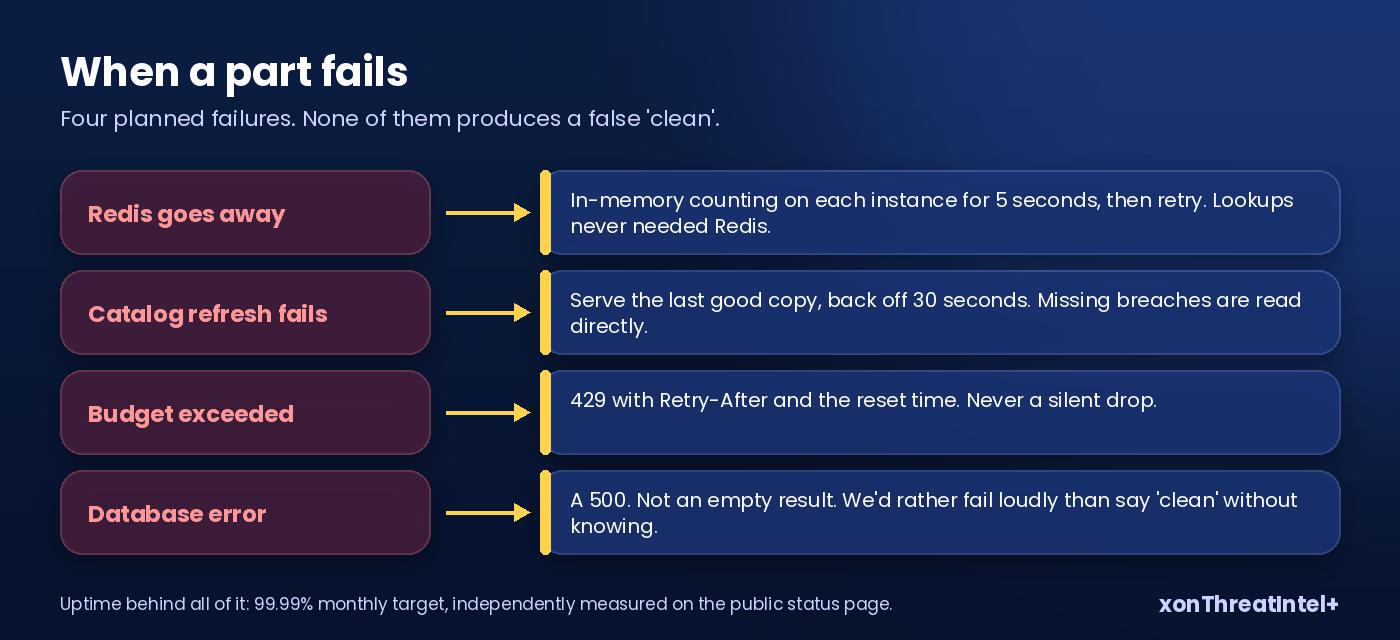
Redis goes away. The rate limiter switches to in-memory counting on each instance for a five-second cooldown, then tries Redis again. Checks keep answering, because the lookup never depended on Redis in the first place.
What if the catalog refresh fails? We keep serving the last good copy, wait 30 seconds, try again. Any breach missing from that copy gets read directly, so nothing new is hidden by a stale list.
Your budget runs out: a 429 with Retry-After. Said above, worth saying twice, never a silent drop.
The one we care about most is a database error, because the tempting shortcut is to return an empty result. We don't. You get a 500.
We'd rather fail loudly than tell you an address is clean when we don't know.
And the uptime behind all of it: a 99.99% monthly target, measured by an independent monitor on a public status page , with the last 90 days on the SLA page (100% as of 9 October 2026).
Receipts you can check without asking us
Everything above is inspectable, and we'd rather you did inspect it. The API code is public. CodeQL, Bandit, a dependency audit and a fuzzer run on every change, the OpenSSF Scorecard sits on the front page of the repo, and the container runs as a non-root user on a base image pinned by digest (a tag can move under you, a digest can't).
Where the data comes from, and how a breach is verified before it's indexed, is on the methodology page . The infrastructure (Cloudflare in front, Cloud Run behind, TLS 1.3 in transit, AES-256 at rest) is on the security page.
If you want the story of how this got fast, the rebuild from Flask to FastAPI in 2025 is the chapter before this one. Requests over a second had become an everyday thing back then. They aren't now.
What this means when you build on it
Embedding the check in a product? The call is simple enough to run inline inside signup or login: one GET, a 23 ms median, a 429 you can handle. We've written up how to turn a hit into a step-up challenge rather than a wall, and six ways to show exposure on a product screen without alarming anyone.
If you're an MSSP, the same lookup sits behind every client view in the dashboard, so "how fresh is this, how fast is this" has one answer for all of your clients. A vendor monitoring loop makes its checks on the same route, at the same speed.
And what it costs. xonAPI+ starts at $9 a month for 50 requests a minute and scales to 25,000 a minute. xonThreatIntel+ is for monitoring domains that aren't your own, client or user, and the API key comes with it.
Quick answers
Does a bigger index make the check slower?
No. We fetch one record by its name, and a bigger catalog just means more sitting on the shelves around it. That's why we can keep adding breaches without ever touching the lookup.
Is "under 100 ms" my round trip?
No. Ours is the clock inside the service (23.4 ms at the median, 10,000 real requests, 11 and 12 October 2026). Yours also has TLS in it, and the flight to Oregon, so the only figure that matters to you is the one you measure from where your product runs.
Do I need a separate API key with xonThreatIntel+?
No, the plan already has one. xonAPI+ is for teams who want the API on its own.
What happens if I exceed the rate limit?
A 429 comes back, with Retry-After on the header and the reset time in the body, so your client waits exactly that long and no longer. Nothing gets dropped on the quiet. Hitting it daily? Time for a bigger plan.
Where the numbers came from
- Breach and record counts: the XposedOrNot metrics endpoint, 12 October 2026 (792 breaches, 11,679,065,842 records).
- Latency: Cloud Run request log for the partner API check-email route, 10,000 consecutive requests, 15:23 UTC 11 October to 06:06 UTC 12 October 2026. Percentiles computed from the httpRequest.latency field.
- Edge cache behaviour: response headers observed on the check-email route, 12 October 2026 (cf-cache-status DYNAMIC).
- TLS handshake figure: curl from Singapore to the partner API host, 12 October 2026.
- Cache lifetimes, limiter fallback, shield check, catalog refresh and failure handling: the XposedOrNot-API repository on GitHub , read 12 October 2026.
- Uptime: plus.xposedornot.com/sla and status.xposedornot.com , figures as of 9 October 2026.
- Akamai, The State of Online Retail Performance , April 2017 (a 100-millisecond delay in page load, 7% lower conversion).
- Earlier posts: FastAPI Rebuild: XposedOrNot Now Runs Lightning-Fast (April 2025); Stop Account Takeover: Step Up Auth on New Breach Exposure; Breach Exposure in Your Product: 6 Patterns That Work; Third-Party Breach Monitoring: Check Every Vendor Domain by API.