
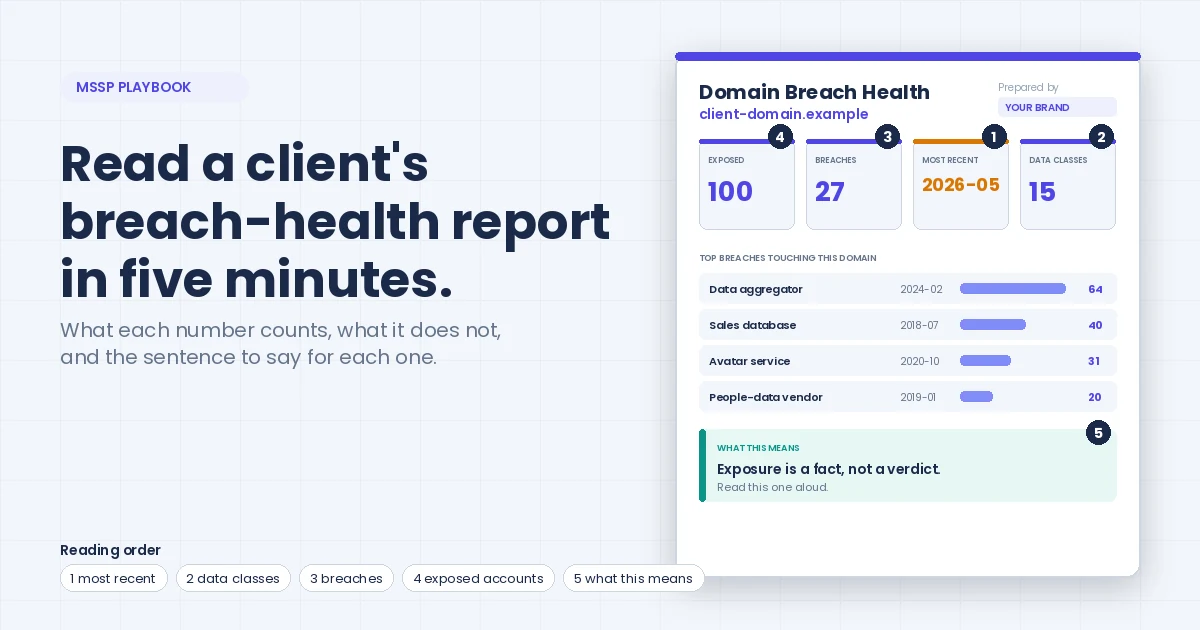
How to Read a Domain Breach-Health Report
A domain breach-health report answers one question for a client: which of their email addresses have turned up in known data breaches, in which ones, with what data attached, and how recently.
It's built from a breach index, not from the client's own systems. So every number on it is a public exposure fact, and not one of them says whether anyone has actually got into an account.
Read it in the right order and every figure turns into a sentence you can say to the client with a straight face. Most recent first. Then data classes, the breach table, the headline counts.
Console, partner API, or a webhook into your own tools: same numbers, three doors. As of 7 September 2026 the index behind all three held 783 breaches and 11.62 billion records.
The short version
- Four headline tiles, four client questions: how many of us, from where, is this new, what do they have.
- Records, addresses, breaches. Three different counts. Never read one as another, and never read any of them as people.
- "Most recent" decides whether this is a meeting or an email.
- The report shows what leaked. It doesn't show who's logged in where. Say so before the client asks.
- The report is the partner API's domain-summary call with your logo on it. Console, API, or your own tools, the numbers match.
Who this is for, and where the report comes from
We run the breach index behind XposedOrNot and xonThreatIntel+. MSSPs and MSPs use the multi-client product to watch their clients' domains and hand each client a report under their own brand. You can pull it on demand from the console, or schedule it monthly. Either way it's computed from the index at the moment it's produced.
So this post walks through that report, one section at a time. The sample client is examplecorp.com, prepared by a made-up MSSP we're calling Northwind Security. Real breach names stay in, because the breaches are public. For each field you get three things. What the number counts. What it doesn't. And the sentence we'd say to a finance director who's reading it over your shoulder.
One caveat. If the client's opening question is "can you check the dark web for us?", start with what to actually tell them and come back. This post assumes the report's already in your hands.
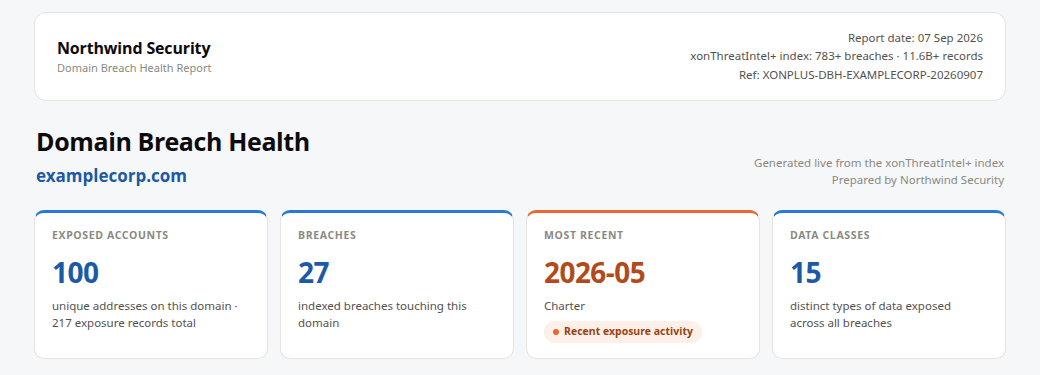
The header: whose report is this?
Small section. Easy to skip. And the one clients look at first.
Your name and logo, the report date, the size of the index behind it, a reference code. The logo's yours, not ours; the white-label post goes into why that matters more than it sounds.
The index line ("783+ breaches, 11.6B+ records" on the sample) is there for one reason. Numbers move between reports, and the client needs to know why. Breaches get added weekly (125 so far in 2026, call it three a week). A domain showing 27 breaches in September can show 29 in October without a single new incident at the client's end. When that happens, point at this line.
We'd say: "This is our report, generated today, against an index of about 780 known breaches. The counts move as breaches get added, so treat it as a photograph, not a ledger."
The four tiles: four questions
Clients ask the same four things. Roughly the same order, too, whether or not they say them out loud.
| Tile | The client's question | What it counts |
|---|---|---|
| Exposed accounts | How many of us? | Unique email addresses on the domain seen in at least one breach, with the total exposure records beneath it |
| Breaches | From where? | Distinct breaches in the index that contain at least one address on this domain |
| Most recent | Is this new? | The breach date of the newest breach touching the domain, with a flag if it falls in this or the previous calendar year |
| Data classes | What do they have? | Distinct types of data exposed across all of those breaches |
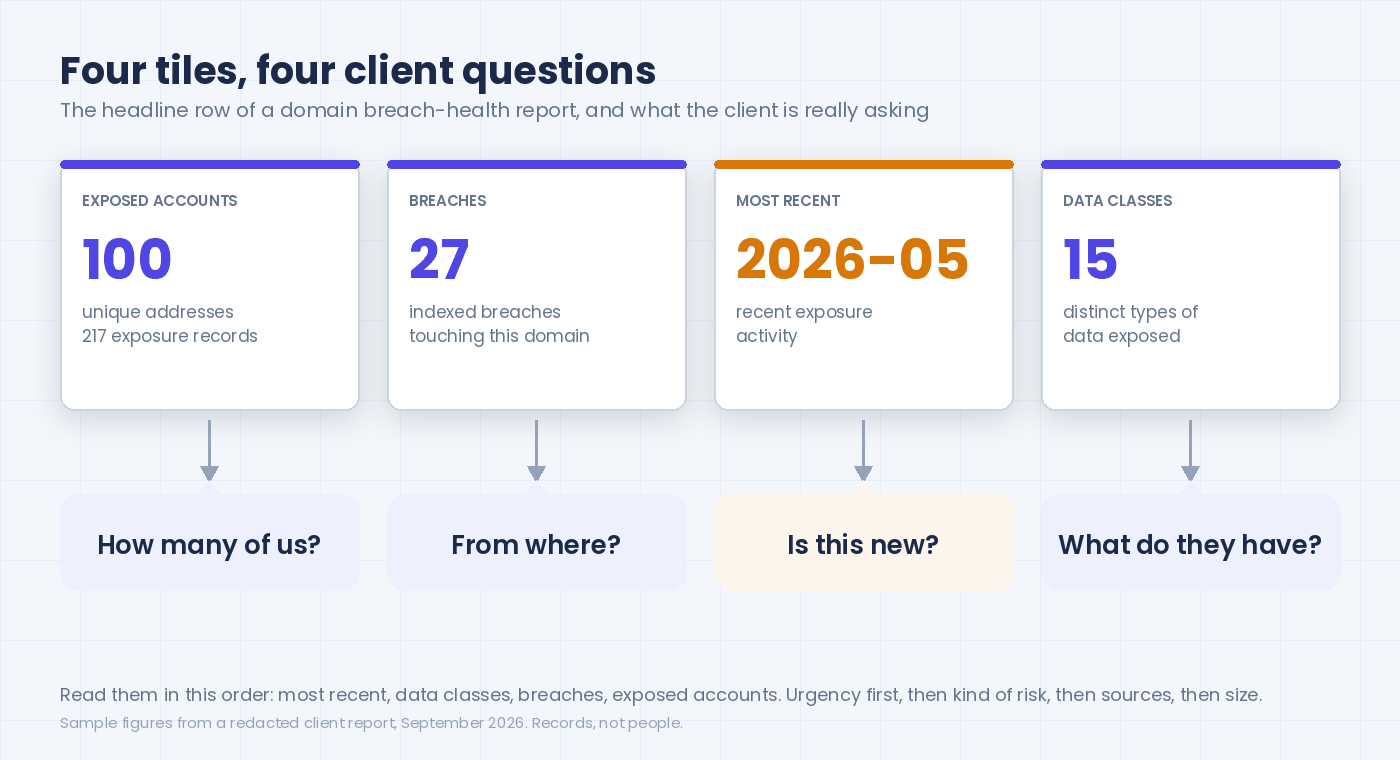
Exposed accounts
100 unique addresses. 217 exposure records. Same tile, and the gap between those two numbers is the first thing you'll explain.
An address that shows up in four breaches is one exposed account and four exposure records. Same problem, seen from more directions. Not a bigger problem.
And here's where the call goes wrong. "217 exposures" lands on a non-technical client as 217 people, and examplecorp.com might have 60 staff. So the report must be wrong, right? Records, not people. We say it in every post we write, and it's the sentence that saves the most client calls.
They're not all current employees, either. Former staff. Shared inboxes like sales@ and support@. Aliases. That service account somebody set up for an integration in 2019 and forgot about. All of it lives under the domain. In our experience, 100 exposed addresses at a 60-person firm is about par. Boring, even. (The account takeover guide covers why domain-level coverage beats a roster, if you want the long version.)
We'd say: "One hundred addresses under your domain have turned up in at least one breach. Some are current staff, some are old, some are shared inboxes. We'll go through the list and mark which ones still log in anywhere."
Breaches
Twenty-seven, on the sample. Distinct breaches with at least one address from the domain in them.
On its own? Tells you nothing about how bad any of them were. Twenty-seven old data-broker scrapes from 2018 is one kind of report. Three breaches, one of them a 2026 stealer log, is a very different one.
Clients latch on to this number because it feels the most solid. Why read a tile that says 27 before the one that says May 2026, though? Move them off it gently. The next tile carries the weight.
For this one: "Your addresses appear across 27 separate breaches. Most will be old and low grade. The table further down tells us which ones matter."
Most recent
May 2026 on the sample, a breach the index calls Charter, with a "recent exposure activity" flag beside it.
We read this tile first. Every time.
Why? Because our own disclosure-lag analysis puts the median gap between a breach happening and its data reaching our index at 1,591 days . Over four years. Most of what any report contains is old. So a breach dated this year or last is the odd one out: still circulating, still being tried against logins, worth a phone call rather than a paragraph.
What the tile can't tell you is whether the client already dealt with it. A May 2026 breach they rotated passwords for in June is still on the report, because the exposure fact doesn't go away. Your acknowledged alerts in the console fill that gap.
If the date's recent, we'd say: "The newest exposure is from May this year. That's the one we act on first, because recent data is what attackers are actually using." If it isn't: "Nothing here is newer than 2021. Good sign. It's also why we keep monitoring, because the next one will be new."
Data classes
Fifteen distinct types, on the sample. It's a breadth measure: how many kinds of data appear somewhere across all 27 breaches, and so what a stranger could piece together about the client's staff. Names. Phone numbers. Home addresses, job titles, social profiles, that kind of thing.
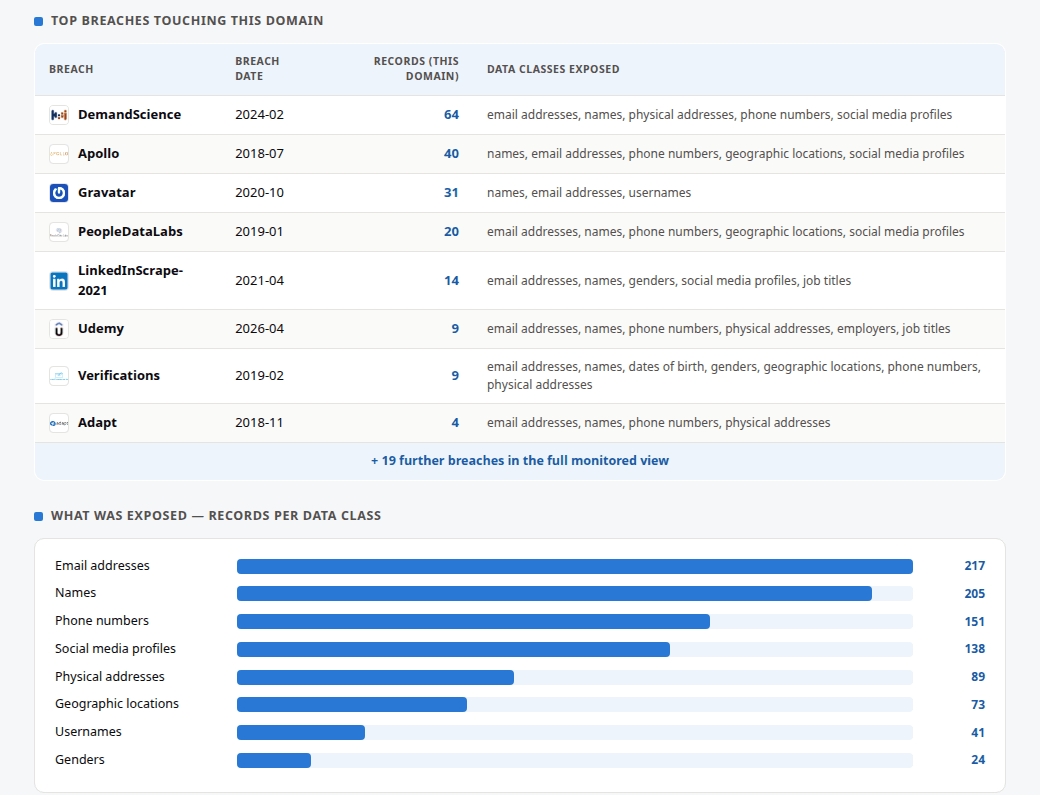
Fifteen sounds like a lot. Is it? Depends what the fifteen are. The bars under the breach table, a bit further down, spell it out. 217 email records. 205 names. Then 151 phone numbers, 138 social profiles, 89 physical addresses. Enough to write a convincing note from "IT" to a named employee that mentions their office and their LinkedIn. Passwords? Tenth. Fifteen records, none newer than 2021, several of them from combolists, sitting below the eight bars the report prints but there in the full view. Say that plainly, because "data breach" and "stolen passwords" are the same phrase in most clients' heads.
So: "Fifteen types of data appear across these breaches, mostly contact details and job information. Expect phishing that uses real names. Not a direct way in."
The timeline: when, not how bad
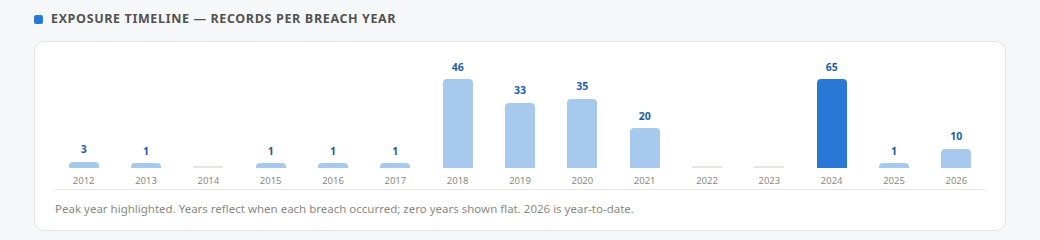
The bar chart plots exposure records by the year the breach happened. Not the year it was discovered. Not the year it reached our index. The breach year.
A hump around 2018 to 2020 usually means a growth spurt: lots of new SaaS signups, and some of those vendors got breached later. A single tall 2024 bar like the sample's is nearly always one big aggregator breach that hoovered up the whole domain in one go. What the chart isn't is a risk trend. Data that left in 2019 may well still be doing the rounds.
We'd say: "The biggest single chunk of what we found traces back to one 2024 breach at a big data vendor. The rest is a long tail going back a decade."
The breach table: where the story is
Got five minutes with the client? Spend four of them here.
One row per breach. Name, breach date, how many of the client's records sit in it, which data classes it spilled. The report prints the largest and the rest live in the console. Rows sort by record count, so the biggest single source of exposure is the first thing they read. On the sample that's DemandScience (February 2024, 64 records), then Apollo, Gravatar, PeopleDataLabs. Three of those four are data aggregators. Nobody at examplecorp.com signed up for those three. Their staff's details were collected, packaged, and then leaked by a company the client has never heard of.
That's the moment the report earns its keep. The client walked in thinking breaches happen to companies that get hacked. They walk out knowing most of their exposure is a by-product of other people's businesses. (Took us a while to say that sentence plainly, too.) The most-breached industries analysis has the numbers if they want them.
Three things to read off each row. The date first: a 2026 row with a stealer-log source is the row you act on today, and stealer logs are a different animal from a breach, which is why they change the alert picture for MSSPs. Then the record count, because sixty-four records can be sixty-four addresses or a handful seen many times, and only the console shows which. Then the data classes. Passwords in that column bumps the row's priority regardless of date. A reused password from 2019 still opens doors in 2026.
We'd say: "Your single largest source of exposure is a marketing data vendor breached in 2024. Sixty-four of your records were in it: names, contact details, social profiles. No passwords. The one we want to look at closely isn't in this table at all. The May 2026 entry is a single address, so it sits with the 19 further breaches in the full view."
"What this means": three sentences we write for you
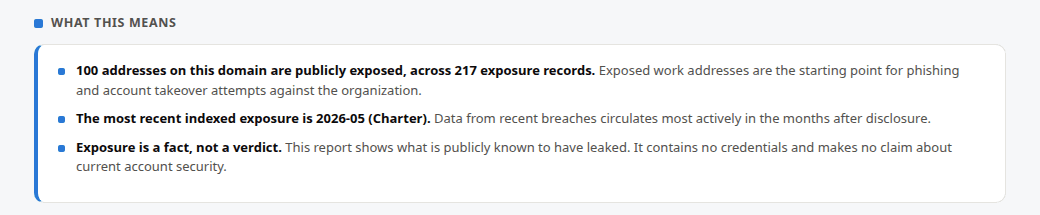
Near the bottom the report states its own conclusion in three bullets. The third is the one we'd rather you never had to write yourself:
Exposure is a fact, not a verdict. The report shows what is publicly known to have leaked. It contains no credentials and makes no claim about current account security.
Read it aloud. It keeps the call calm, and it keeps you honest, because nobody can tell from a breach index whether an account is compromised today. What the index can tell you is which addresses to check, and in what order.
From report to console: where the detail lives
The report is the client-facing summary. The console behind it holds what an analyst needs, and it's worth showing the client once so they know what you're looking at when they ring.
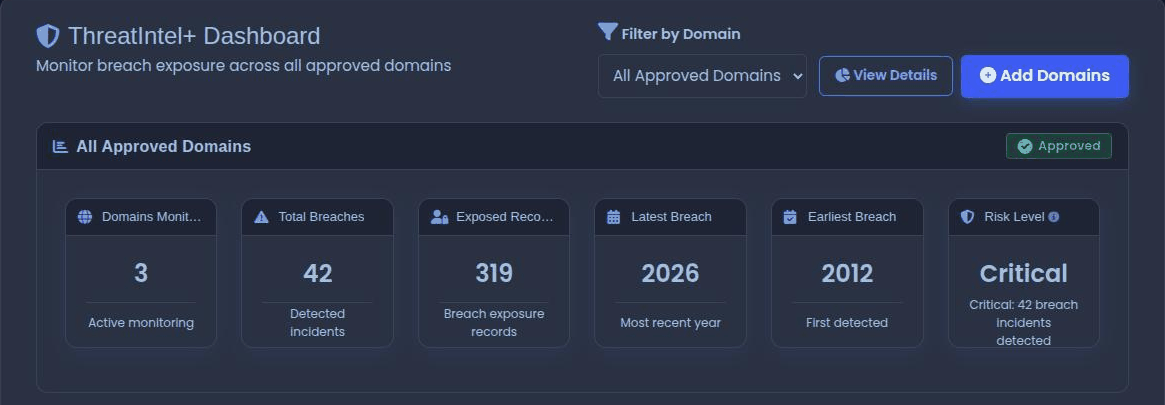
The portfolio view is every client domain on one screen. Drill into one and you get the per-client breakdown: exposures, unique addresses, unique breaches, a risk score. And the bit clients always ask about, which is how many of the exposed addresses belong to executives, VPs, and directors. The detail view below is a second sample client, exampleclinic.org: 254 addresses across 40 breaches, 315 exposure records, a risk score of 96. Different domain, same fields.
Settle one thing before a client ever sees this screen. The risk score and that red Critical label are triage for you, a way to sort a portfolio by where to look first. They're not the sentence you say to the client. More on that in a moment.
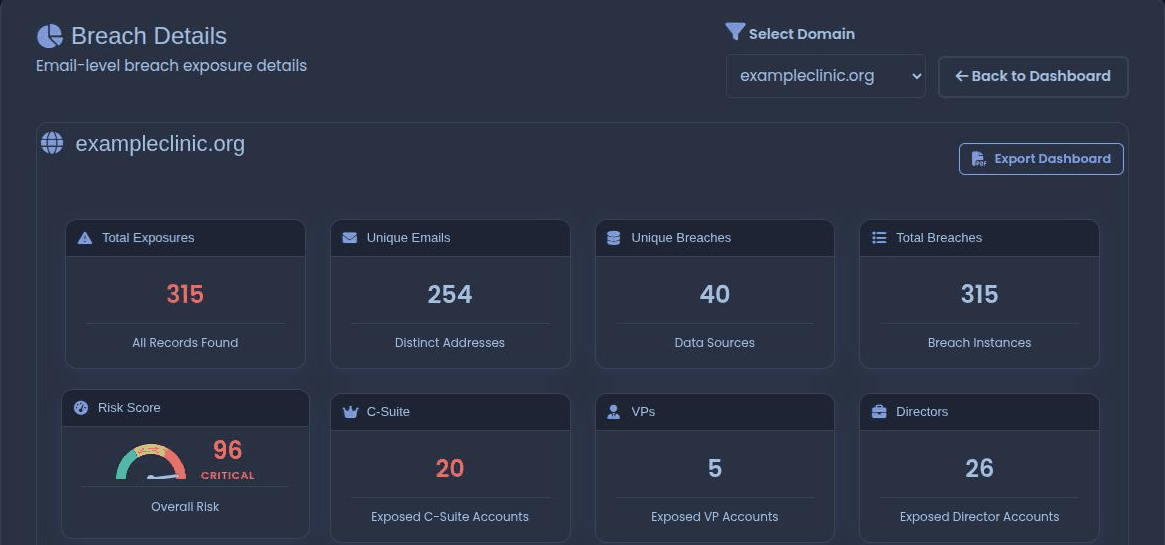
The examplecorp.com report has no seniority section, because the index couldn't classify roles for that domain. When it can, the report carries a seniority chart. Either way, "20 exposed C-suite accounts" needs a conversation around it, not a PDF. Bring it up in the meeting, list in hand.
Then the alerts panel. Every new breach that touches a client domain lands here: breach name, affected domain, affected address count, a severity label, an acknowledge button. The password-risk column is the breach's own password_risk field from the index, and Unknown just means the index holds no password-strength data for that breach. Honest default. Acknowledging is your audit trail. When the client asks "did you deal with the May one?", the acknowledged timestamp is your answer.
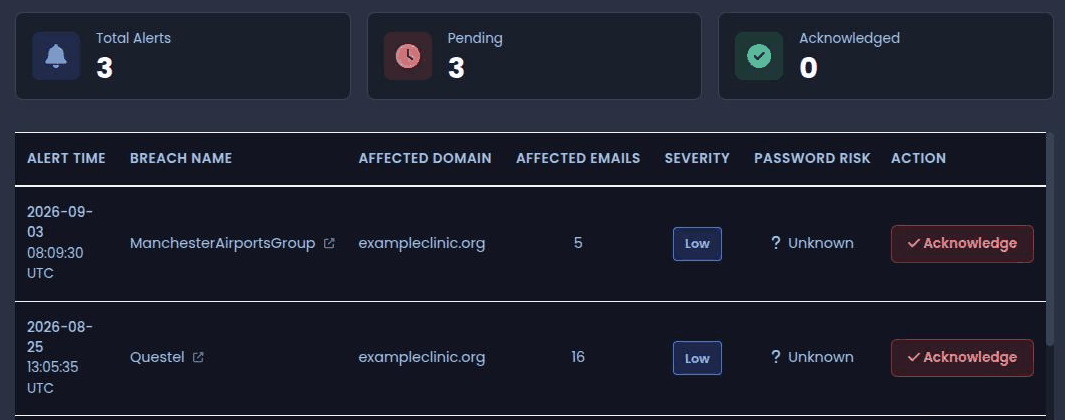
Route those alerts somewhere your team actually looks. Slack, Teams, and webhook routing has the patterns.
Reading order, and what not to say
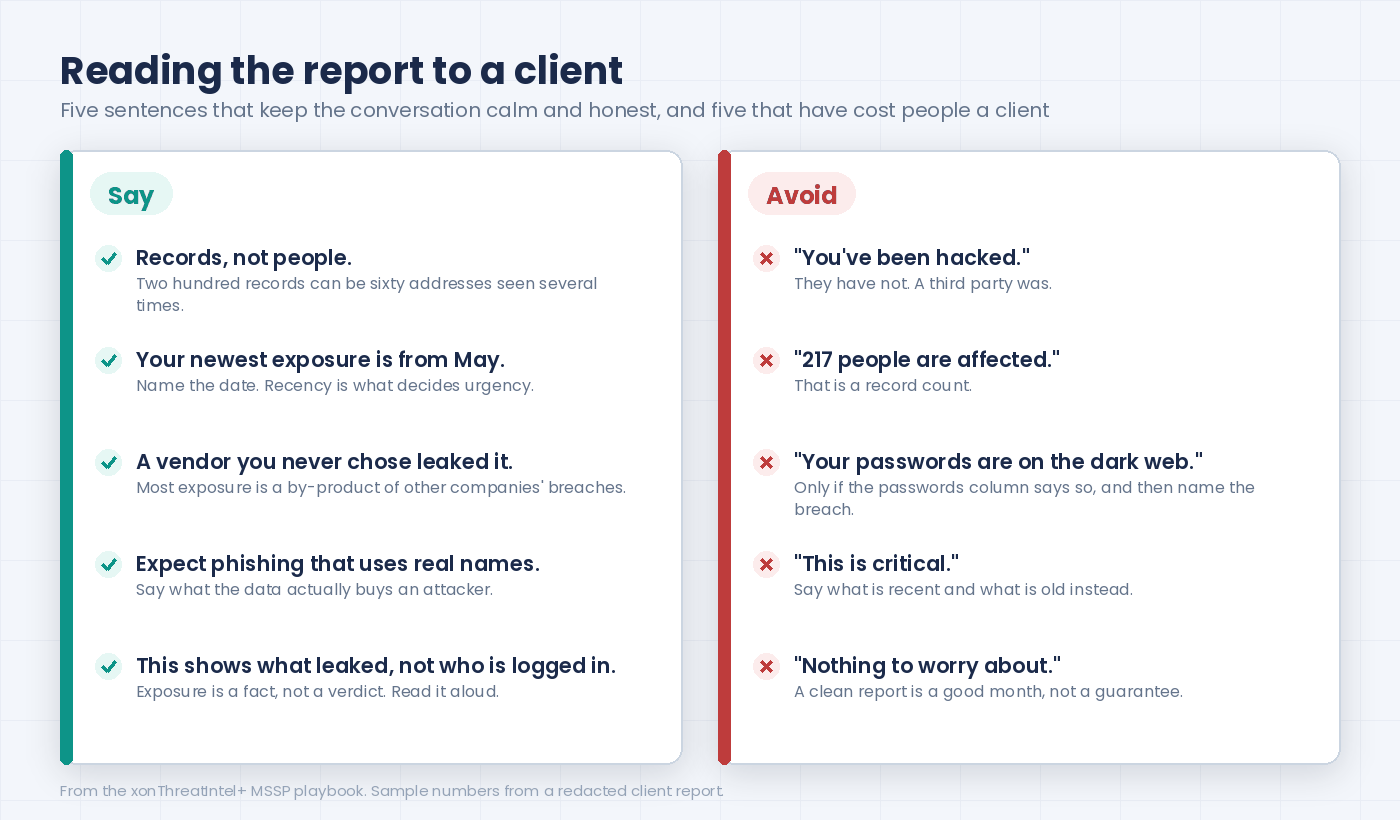
Most recent. Data classes. Breach table. Headline counts. Then the "what this means" block, read aloud. That order, every time.
And the things not to say, because each of them has cost someone a client:
- "You've been hacked." They haven't. A vendor they never chose has.
- "217 people are affected." Records, not people.
- "Your passwords are on the dark web." Only if the passwords column says so, and even then, name the breach.
- "This is critical." Say what's recent and what isn't, and let the client hear the difference.
- "Nothing to worry about." A clean report is a good month. Not a guarantee.
The question every walkthrough ends with
"Why does my report have 27 breaches and my competitor's has 40? Are we safer?"
Not necessarily. Exposure count follows domain age, headcount over time, and SaaS appetite far more than it follows security practice. A ten-year-old firm of 200 will nearly always outscore a three-year-old firm of 20. Compare the client to their own last report, not to anyone else's.
Three ways to get the same numbers
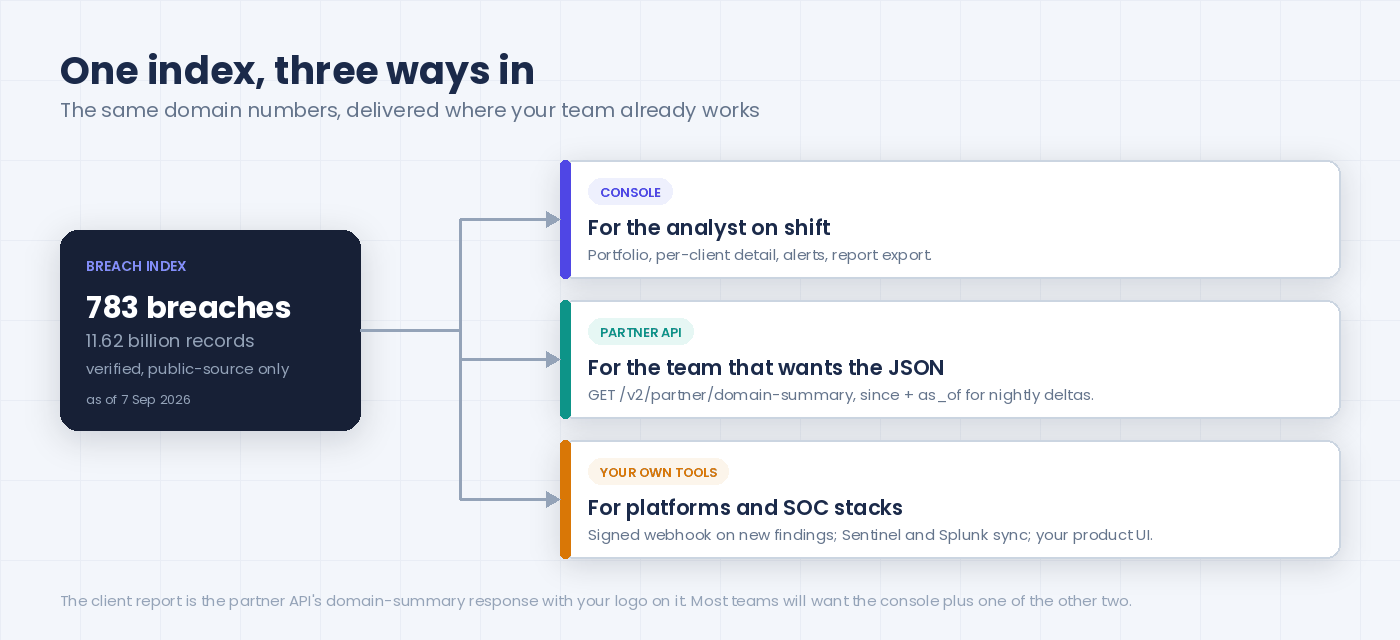
Everything above came out of one index. How it reaches you is up to you, and this bit is for whoever runs your tooling. Most teams will want the console plus one of the other two.
The console is what the screenshots show. Portfolio, per-client detail, alerts, report export. Good for the analyst on shift and for the client walkthrough.
The partner API is the report without the logo. Literally: the client report is one call to the domain-summary endpoint, documented on the Checking Breaches page of the partner API reference.
curl -X GET "https://plus-api.xposedornot.com/v2/partner/domain-summary?domain=examplecorp.com&details=true" \
  -H "X-API-Key: YOUR_API_KEY"
Every field on the report comes back under a stable name, so the four tiles are a few lines of code:
import json, sys
d = json.load(sys.stdin)                       # the domain-summary response
info = d["Detailed_Breach_Info"]
print("exposed accounts:", d["Domain_Summary"][d["domain"]])
print("exposure records:", sum(d["Breach_Summary"].values()))
print("breaches:", d["breach_count"])
print("most recent:", max(b.get("breached_date", "")[:7] for b in info.values()))
classes = {c for b in info.values() for c in b["xposed_data"].split(";")}
print("data classes:", len(classes))
Yearly_Metrics is the timeline. Top10_Breaches is the table. Seniority_Summary is the executive breakdown from the console. Add since=<timestamp> and the same call returns only breaches ingested after that instant, which is how a nightly job keeps a client's numbers current without re-reading the whole domain. Limits are per key (25 a second, 5,000 an hour on this endpoint), and every response tells you how much budget is left in its headers.
Your own tools is the third door, and the one platform teams take. Register one account-level webhook and every new breach that touches any of your client domains sends a signed notification like this:
{
  "event": "new_findings",
  "as_of": "2026-08-29T10:15:00+00:00",
  "domains": [
    { "domain": "examplecorp.com", "new_breaches": ["ExampleBreach"], "new_records": 42 }
  ]
}
No email-level data travels in it. Your endpoint reads as_of, calls domain-summary with it as since, and the new rows land in your SIEM, your ticket queue, or your own product UI. Deliveries are signed (HMAC-SHA256 over the raw body, plus a timestamp header against replays), so a forged alert gets rejected before anyone reads it. Running Sentinel or Splunk? The Microsoft Sentinel and Splunk integrations do the scheduled sync for you.
Building breach exposure into a product of your own? That's the Platform mode of xonThreatIntel+. Two pages your security reviewer will ask for before anything else: our data page, on where the index comes from and what we refuse to store, and the DigitalTrack case study, an MSSP running all of this in production.
Check your own domain first
We say this to every MSSP who onboards. Before you read a client's report, read your own. Monitoring the domain you own is free on XposedOrNot, no plan required: run the domain exposure check and you'll get the same counts your clients will. The CxO dashboard walkthrough on our community blog covers that free view field by field.
Better rehearsal than any sample. The addresses in it are yours.
And when you're ready to run it for clients, xonThreatIntel+ for MSSPs is self-serve: plans from $99 a month, monthly billing, a client domain live in under an hour. The first report is usually the conversation that opens the engagement.
Frequently asked questions about domain breach-health reports
What is a domain breach-health report?
A summary of every email address on a company's domain that appears in known data breaches, drawn from a breach index. It lists the breaches, the dates, the types of data exposed, and how recent the newest exposure is. It reports public exposure facts, not the current state of any account.
Why do the numbers on a client's report change between months?
Because the index grows. New breaches are added weekly, and an older breach can be added years after it happened. A client's counts can rise without any new incident at the client. Compare each report to the previous one, and use the "most recent" date to tell new exposure from newly indexed exposure.
Does the report contain passwords?
No. It shows which data classes appeared in each breach, including whether passwords were among them, but it never reproduces credentials. The index stores exposure facts, not the leaked data itself.
How often is the report generated?
Whenever you ask for it from the console, and as an automatic monthly report under your brand if you schedule one. Every report is computed from the index at the moment it's produced.
Can the report say whether an account has been taken over?
No. Breach data shows what leaked and when. Whether anyone has used it against a login is only visible in the client's own sign-in logs. The report tells you which accounts to check first.
Appendix: sources and references
- Index figures (783 breaches, 11,621,497,431 records, all 783 listing email addresses, 516 listing passwords, 125 added in 2026 to date) pulled live from the public API on 7 September 2026. Reproduce with the script below.
- Sample report: rendered on 7 September 2026 from xonThreatIntel+ partner API data for a real domain pulled on 25 July 2026, with the domain and partner names replaced (examplecorp.com, Northwind Security). Breach names, dates, and counts are unaltered.
- Console screenshots: xonThreatIntel+ partner dashboard, breach details, and alerts views, 7 September 2026, with client domains and addresses replaced by sample values.
- Median breach-to-index gap of 1,591 days: our disclosure-lag analysis, blog.xposedornot.com/breach-disclosure-lag-analysis/, August 2026.
- Industry exposure patterns: blog.xposedornot.com/most-breached-industries/, August 2026.
- Partner API reference (domain-summary endpoint,
sinceandas_ofsemantics, rate limits) and webhook reference (event shapes, HMAC-SHA256 signing, retry behaviour): xonPlus console documentation, ThreatIntel+ module, read 7 September 2026. The curl call, thenew_findingspayload, and the rate-limit figures above are quoted from those pages. - Data sourcing and storage policy: plus.xposedornot.com/our-data, corpus figures as of 3 September 2026.
- Report cadence (on demand or scheduled monthly, white-labelled), plan pricing from $99 a month with monthly billing, and the under-one-hour go-live: plus.xposedornot.com/products/threat-intel/mssp, read 7 September 2026.
Reproduce the index numbers
import json, urllib.request
url = "https://api.xposedornot.com/v1/breaches"
req = urllib.request.Request(url, headers={"User-Agent": "Mozilla/5.0"})
data = json.load(urllib.request.urlopen(req))["exposedBreaches"]
print("breaches:", len(data))
print("records:", sum(b["exposedRecords"] for b in data))
print("with email addresses:", sum("Email addresses" in b["exposedData"] for b in data))
print("with passwords:", sum("Passwords" in b["exposedData"] for b in data))
print("added in 2026:", sum(str(b.get("addedDate", "")).startswith("2026") for b in data))